Exhibition and Interfaces
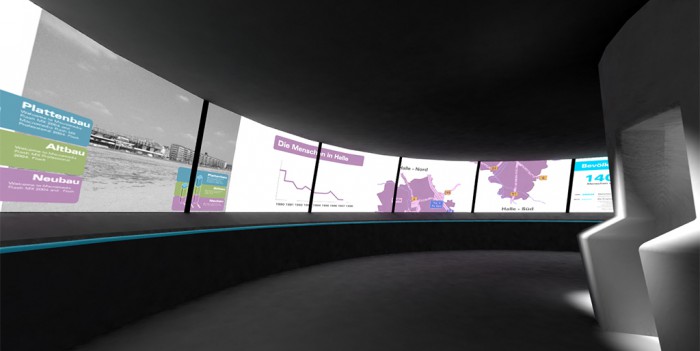
Interfaces and info graphics for the exhibiton WANDEL.HALLE 1200 Years of Halle. The idea was a cirular room mimicking some sort of huge control centre. Data comes in in real-time, showing all kinds of filthy facts about the shrinking city. The goal was to use half animated (digital) and half static back-projections comined in one seamless information panorama. Around the circle, different types of interfaces where embedded to provide interaction with the data.
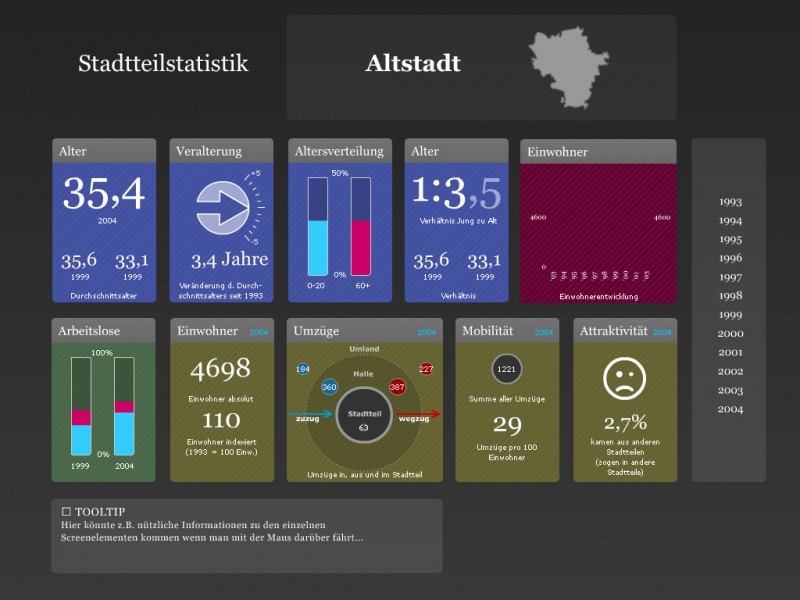
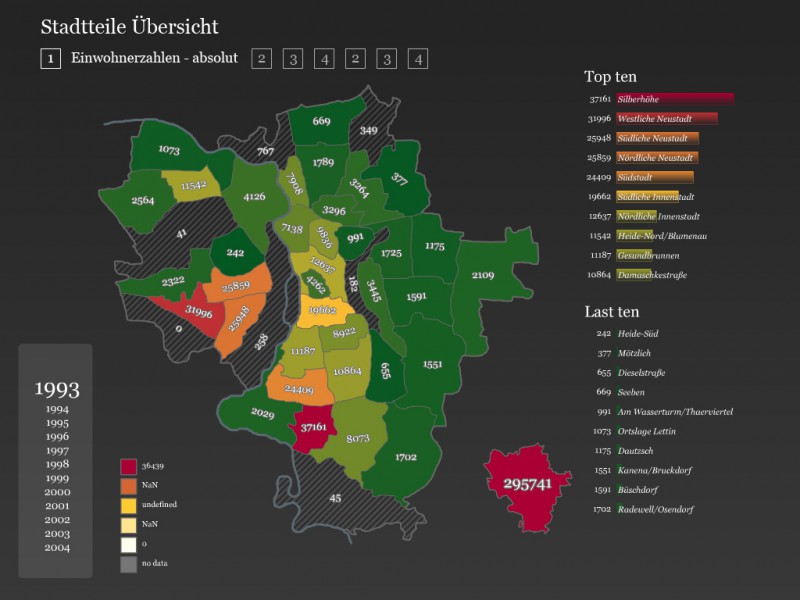
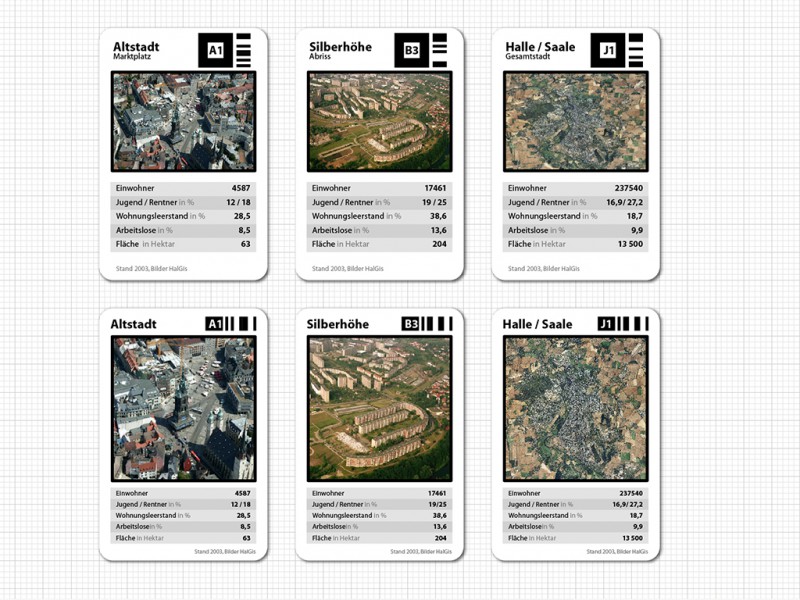
Screen graphics from inside the exhibition: